
Much ink has been spilled about the coming demographic cliff and the decline in college enrollments that will follow. Here, I focus on another question that's less examined but equally fascinating: which majors are shrinking the fastest?
This question is interesting not only for administrators, but also for those wondering what skills the labor market is valuing. A key question students must consider in this turbulent age of AI.
I focus on the change between 2023 and 2024, and look at the 15 fastest shrinking majors on an absolute basis (count of degrees that list that major) and on a relative basis (percentage decline). We'll also consider the current context of overall degree production.
To summarize, between 2023 and 2024, total BA degrees granted fell by around 10,000 degrees to 1.96 million. Of 169 majors, 62% of them experienced a decline in degree production, with a typical decline of 1.4%. And 14 majors declined by more than 10%. Social Science majors led the way, shedding 9200 degrees, while STEM gained 2800. Education is the only other field to have gained graduates (+300).
The Context
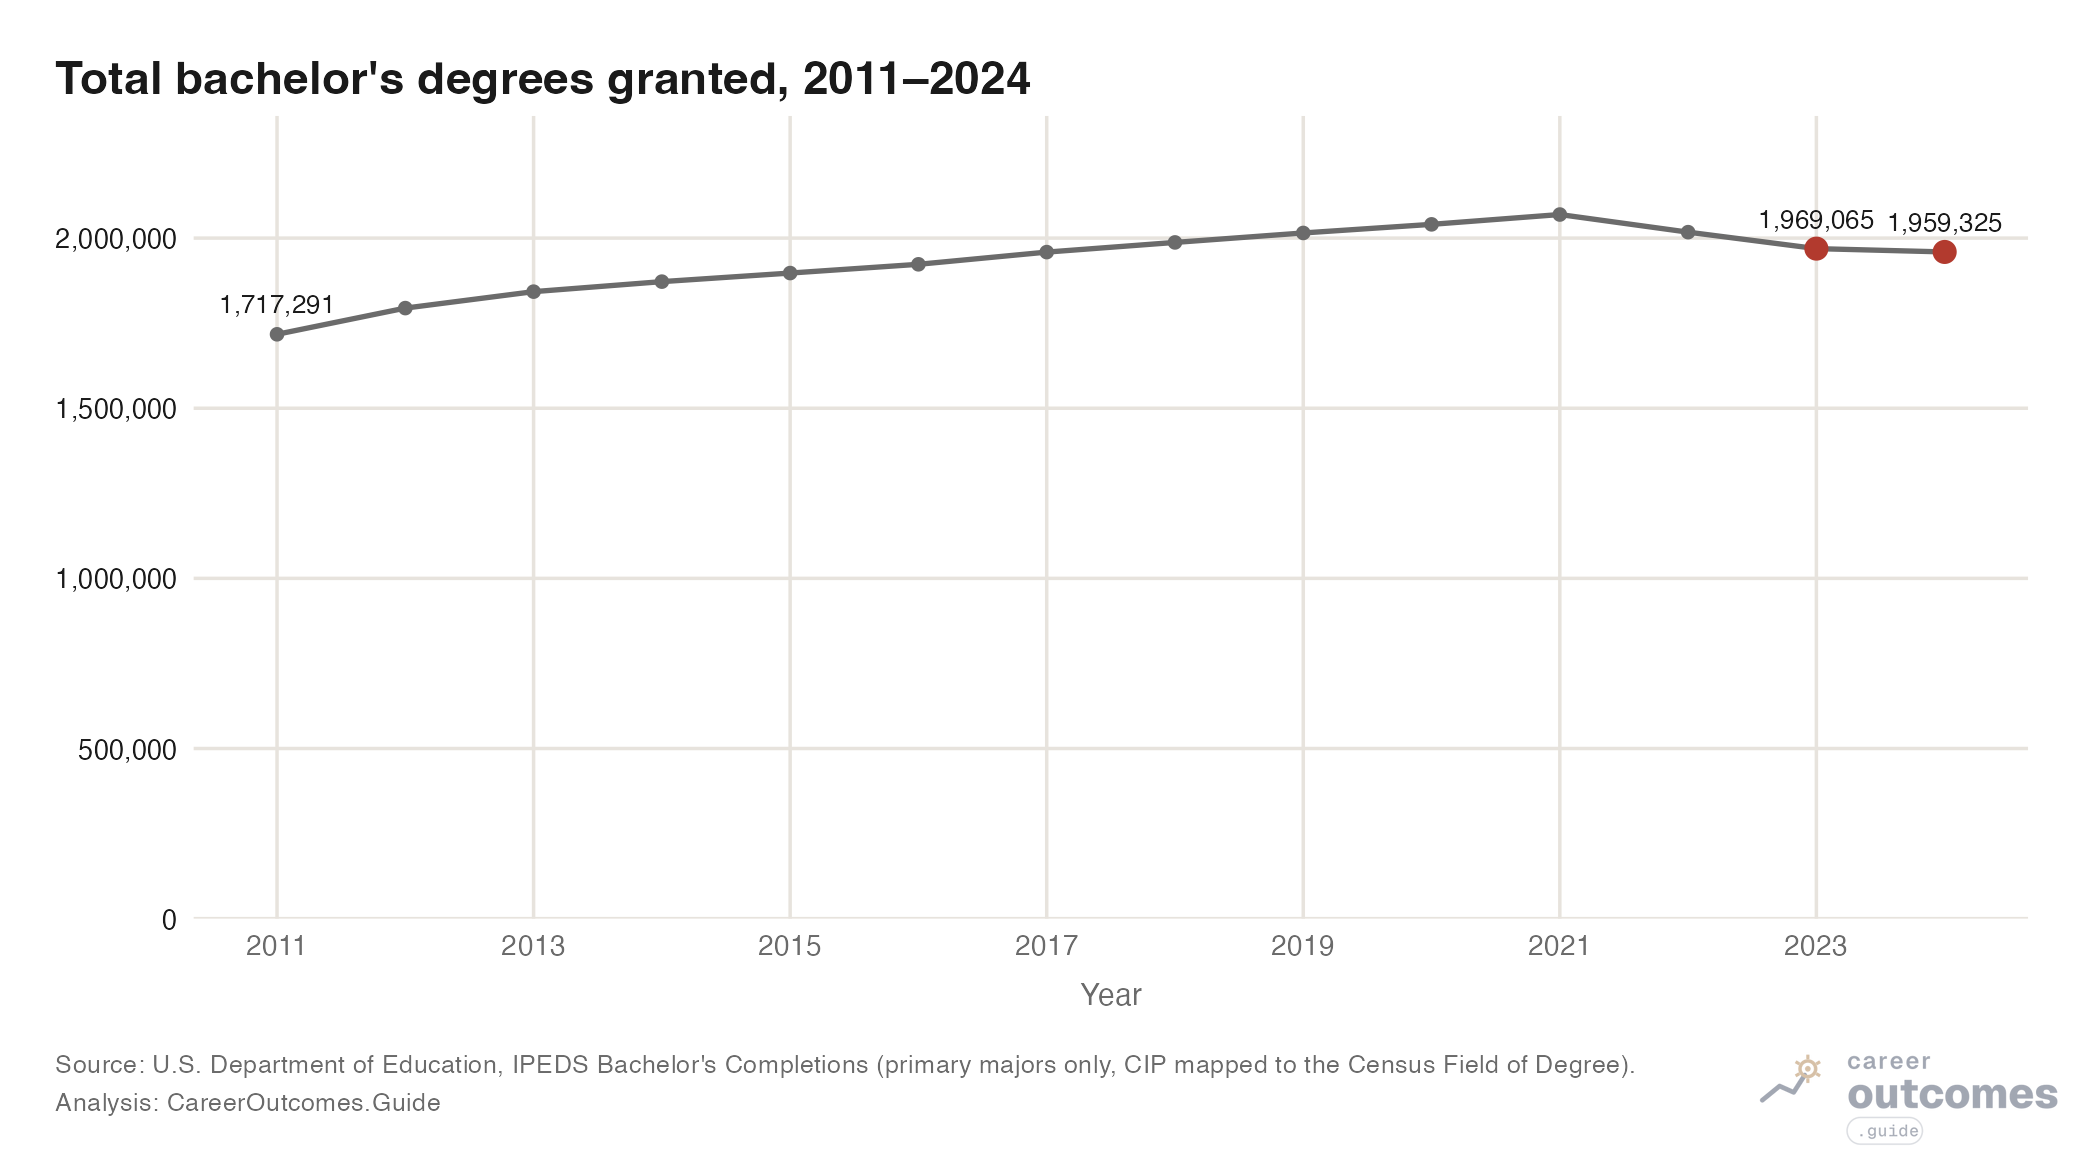
The chart below shows the evolution in the number of BA degrees granted by year. Between 2012 and 2021, times were good, and BA degrees granted were increasing at a rate of 35,200 degrees per year. That all changed in 2022, likely due to COVID-19. In 2022, degrees granted dropped by 52,000. Degrees granted have continued to drop as of our most recent data, dropping by 9700 between 2023 and 2024.
Change by Degree Field
In the table below, I group each major into one of six fields and look at the change in major production by field. We see immediately that STEM resists the decline, actually producing 2800 more majors in 2024, as does Education (+300).
All other fields see declines of several thousand, with social sciences experiencing the largest decline of 9300 majors produced. This pattern is consistent with students swapping lower paying fields for fields with higher returns or career prospects (STEM majors consistently have the highest returns - education was the fastest declining field between 2011-2014 and may have just bottomed-out).
6 of 6 rows
| Social Sciences | 23 | 394,182 | 384,933 | -9,249 | -2.3% |
| Liberal Arts | 31 | 416,924 | 411,773 | -5,151 | -1.2% |
| Business | 12 | 372,019 | 369,467 | -2,552 | -0.7% |
| Health | 9 | 240,374 | 238,222 | -2,152 | -0.9% |
| Education | 13 | 88,328 | 88,647 | +319 | 0.4% |
| STEM | 81 | 551,908 | 554,689 | +2,781 | 0.5% |
The appendix shows the change by field between 2011 and 2024. STEM's gain is even more obvious there (+210K) as is the well-known drop in Liberal Arts majors (-67K).
15 Fastest Shrinking Majors
Absolute Basis (By Count)
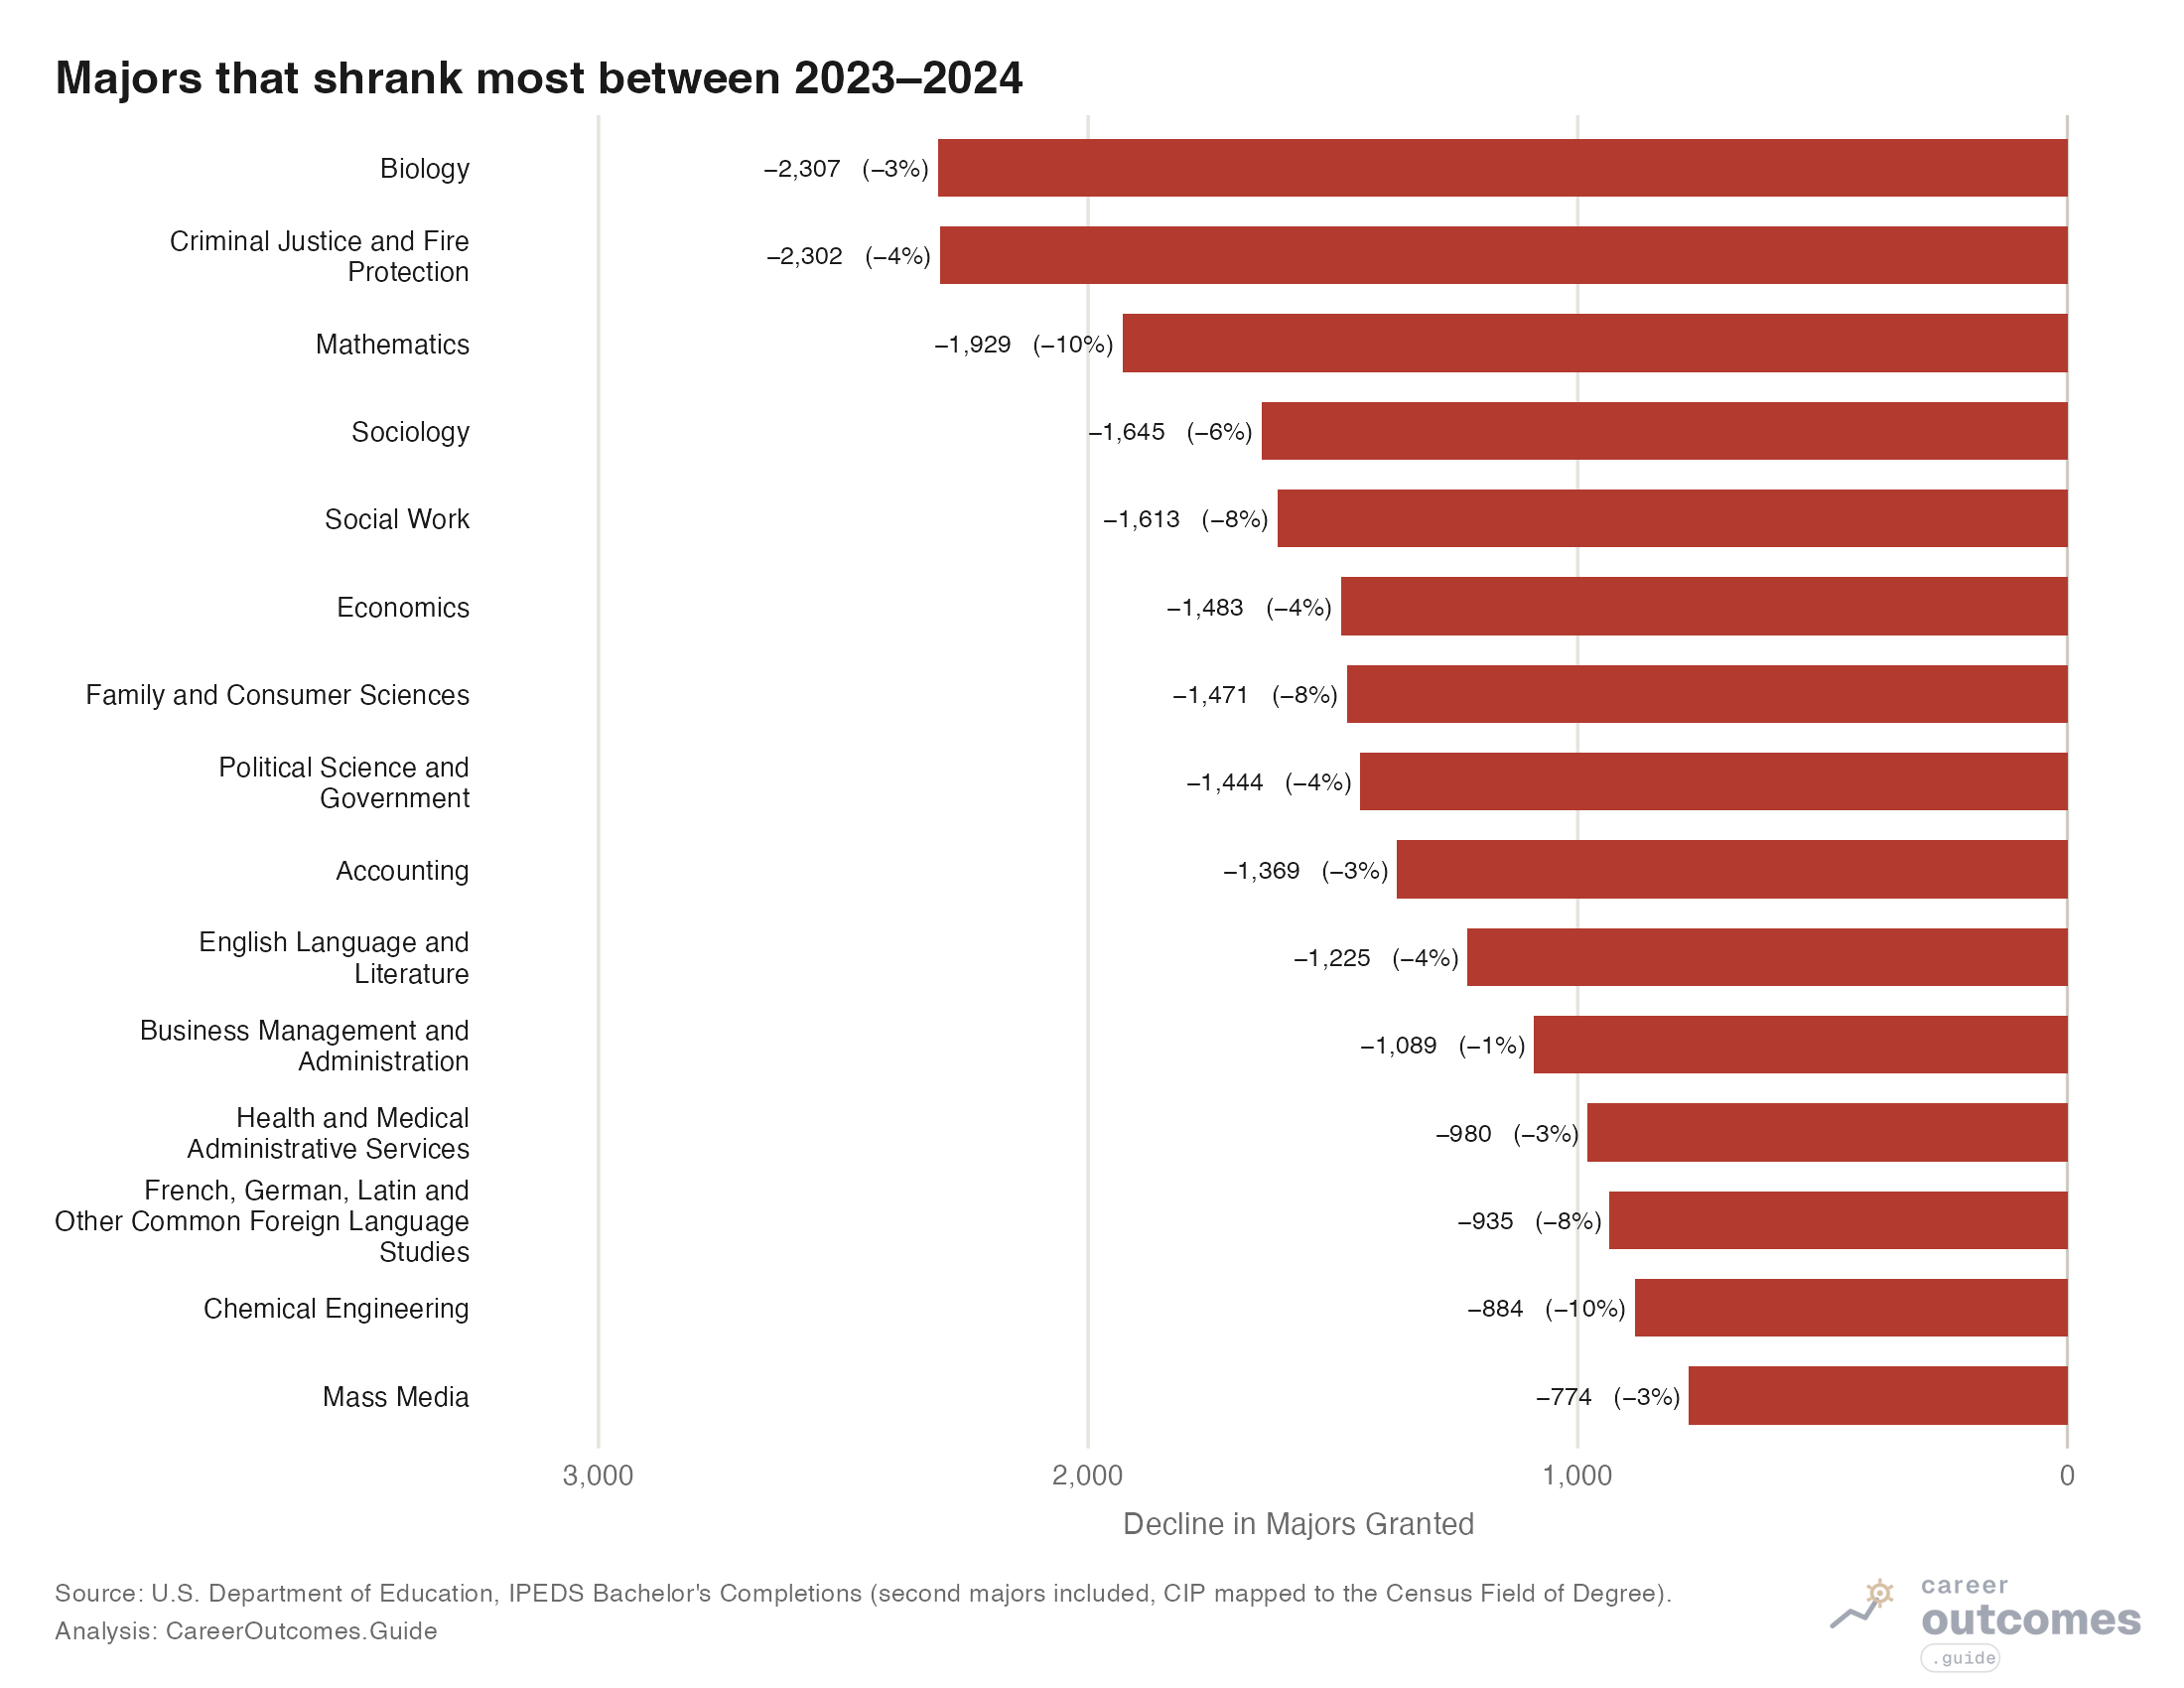
The chart below shows the 15 fastest shrinking majors between 2023 and 2024 by count of degrees. Biology and Criminal Justice led the way, each dropping by 2300. In general, various fields are included in this list, including STEM. Mathematics shed 1900 graduates (3rd most), while Chemical Engineering shed nearly 900 (14th most).
Relative Basis (By Percentage)
While absolute changes capture aggregate changes, relative changes have a larger impact on an academic department or an institution that offers a particular mix of majors. Here, the list looks a bit different, 10 of the majors here are new (Math, Chemical Engineering, Social Work, French and German Languages, and Family and Consumer Sciences are top 15 in terms of both absolute decline and relative decline).
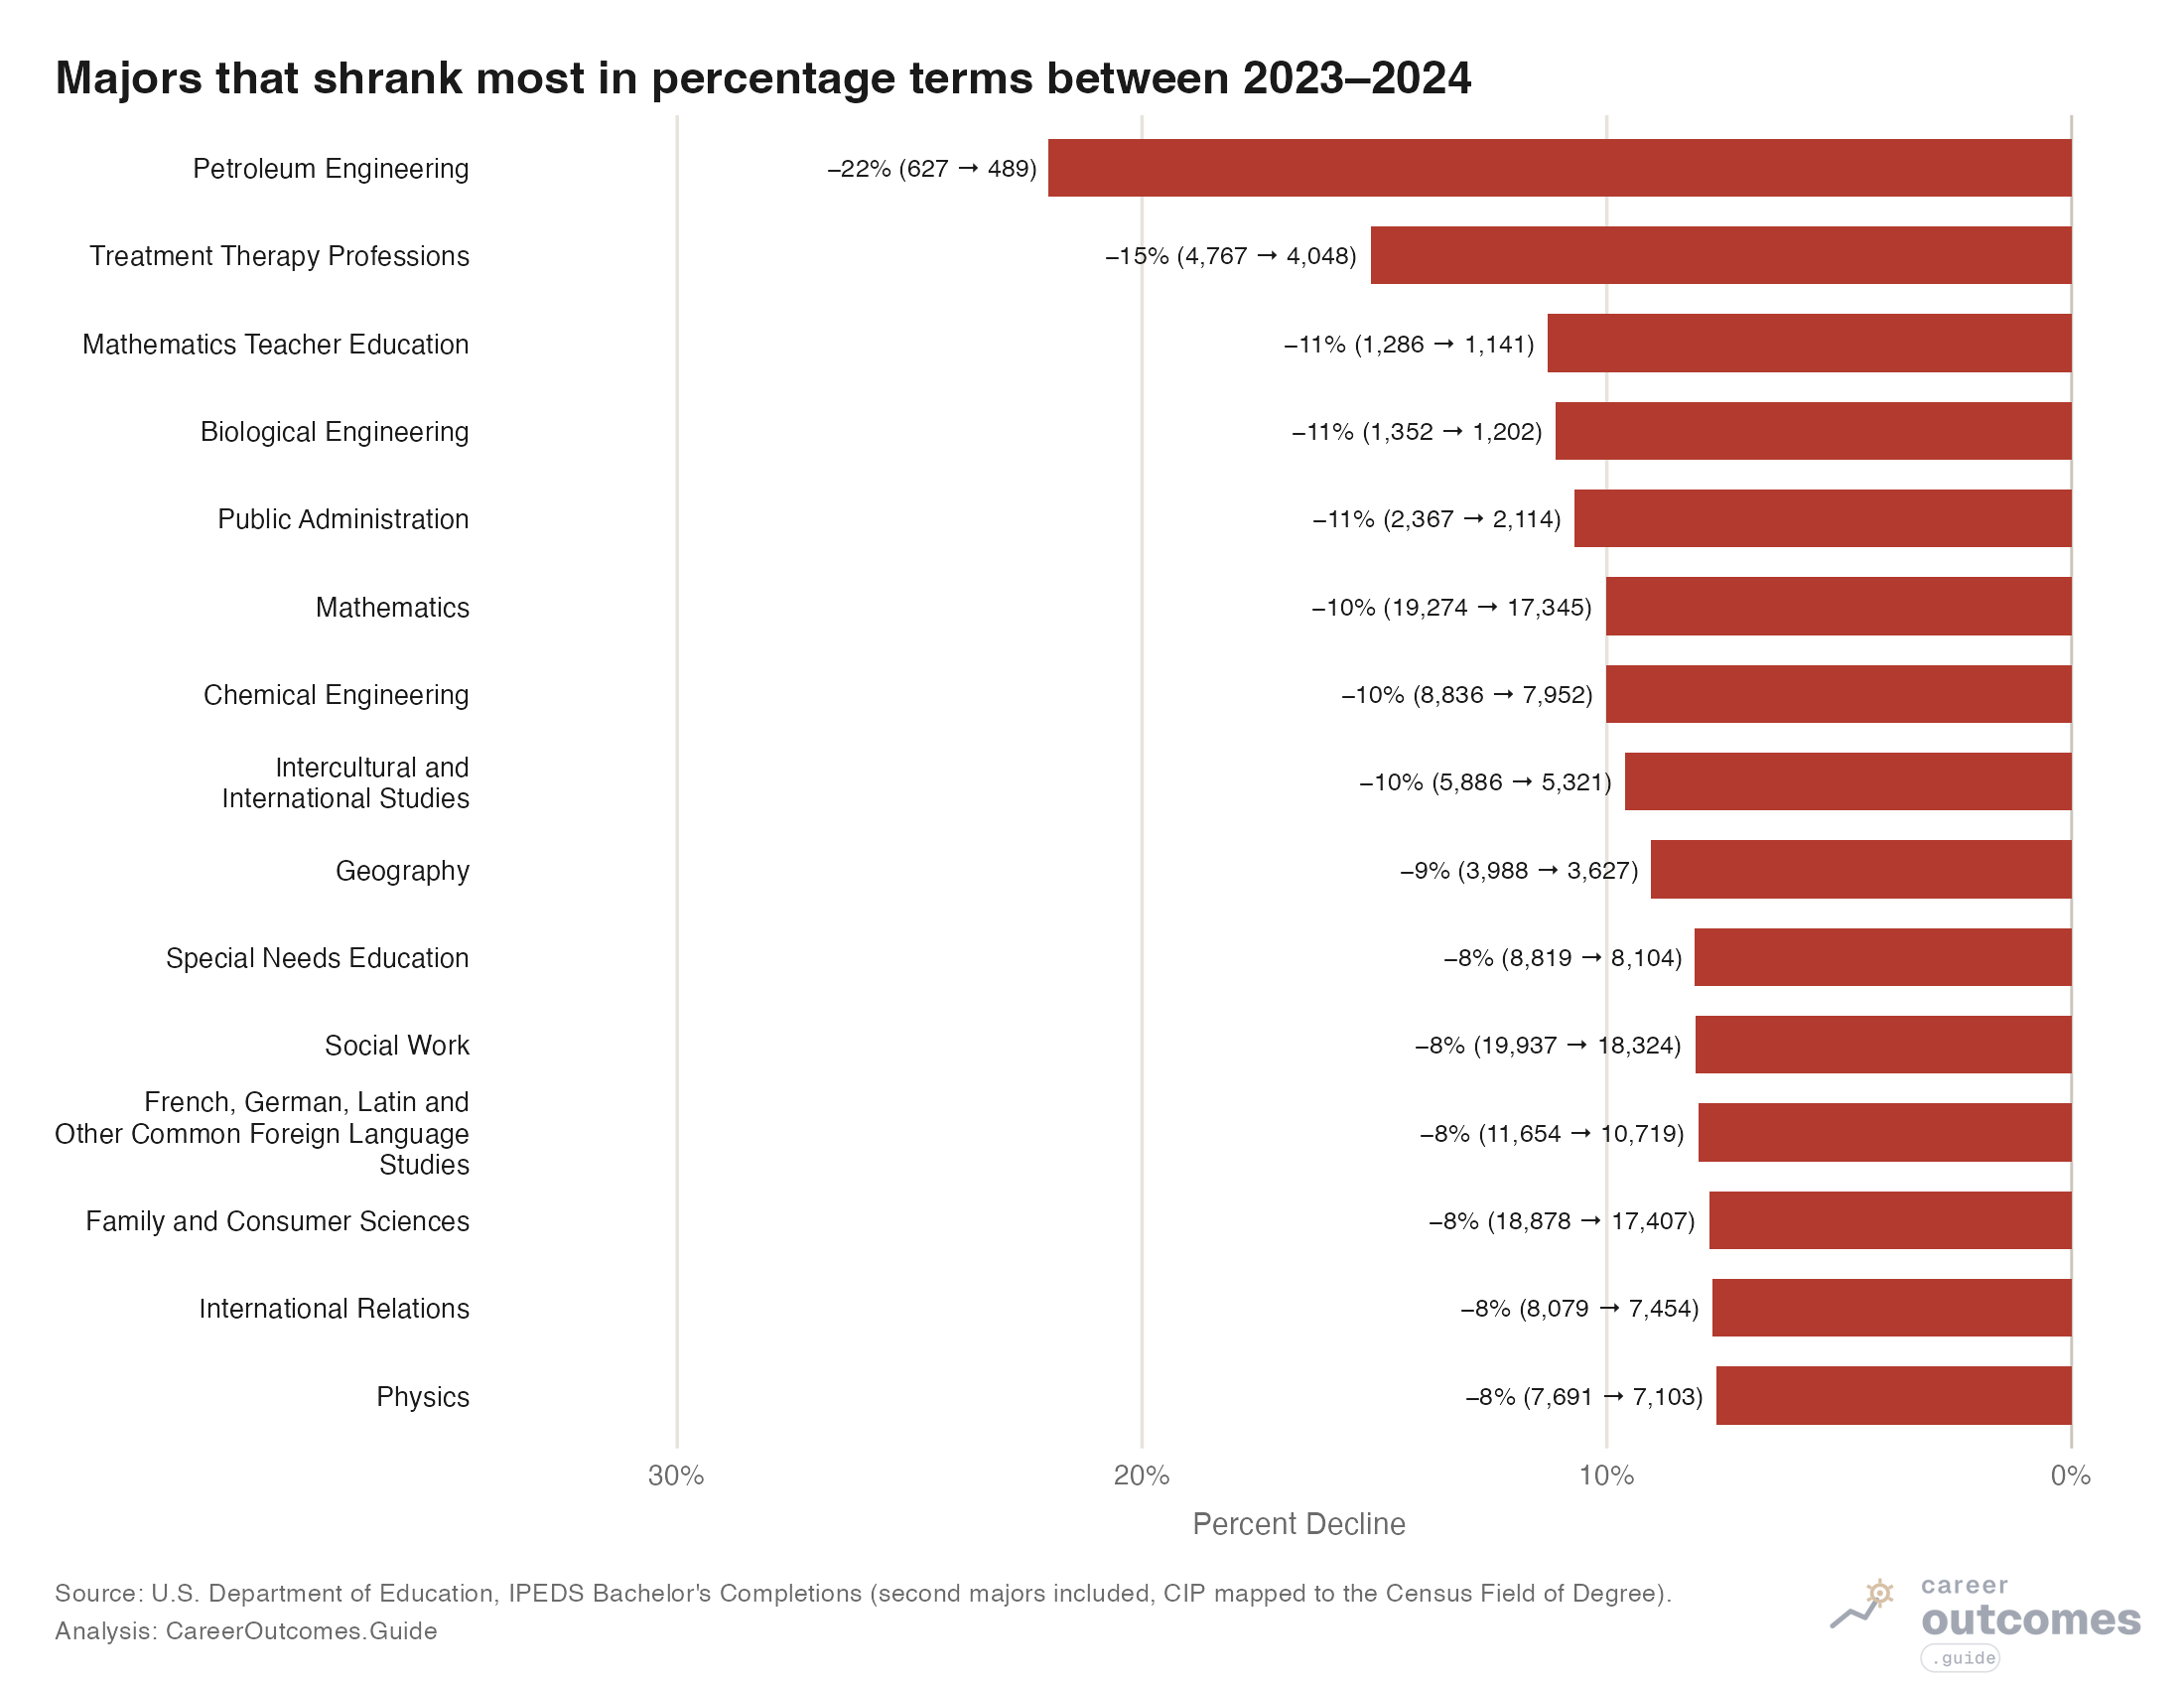
Petroleum Engineering leads the way, declining by 22% in just one year - unsurprising that forward looking students anticipate the shift towards clean energy and the limited career prospects this means for this major. Other majors on the list are harder to interpret. Again we see a mixture of fields in this list.
Evolution of the 15 Fastest Shrinking Majors
Here I examine the evolution of each of the 15 fastest shrinking majors between 2011 and 2024.
We see distinct patterns. Some majors were growing rapidly but only recently have shifted into decline (eg Biology and Math). While others have been in steep decline for a while now (eg Sociology and English Language and Literature).
View data table
| Award year | Bachelor's degrees |
|---|---|
| 2011 | 64,849 |
| 2012 | 68,610 |
| 2013 | 70,940 |
| 2014 | 74,137 |
| 2015 | 76,638 |
| 2016 | 78,726 |
| 2017 | 79,948 |
| 2018 | 80,144 |
| 2019 | 81,530 |
| 2020 | 84,452 |
| 2021 | 87,568 |
| 2022 | 86,187 |
| 2023 | 84,181 |
| 2024 | 81,874 |
Summary
In this post, we saw that since 2022, U.S. BA degree production has been declining by around 36,000 per year. On top of that, a ba degrees continue to be reallocated from other fields to STEM. These fators have contributed to a broad decline in degrees granted in most college majors.
The decline is largest in the Social Sciences, shrinking by 2% between 2023 and 2024. When breaking down the 15 fastest shrinking majors we see distinct patterns when looking at their long run evolution: some have largely been growing over this period, but only recently started declining, while others have been in free fall for awhile now.
Do you have any comments on this article or ideas for what's driving this decline. I'd love to hear from you here.
Appendix
Bachelor's degrees conferred by field of study, 2011 to 2024
6 of 6 rows
| Liberal Arts | 31 | 479,167 | 411,773 | -67,394 | -14.1% |
| Education | 13 | 104,206 | 88,647 | -15,559 | -14.9% |
| Business | 12 | 377,356 | 369,467 | -7,889 | -2.1% |
| Social Sciences | 23 | 368,512 | 384,933 | +16,421 | 4.5% |
| Health | 9 | 135,647 | 238,222 | +102,575 | 75.6% |
| STEM | 81 | 344,375 | 554,689 | +210,314 | 61.1% |
Methodological Notes
We roll up CIP codes to the American Community Survey major level and conduct analysis at that level. When examining evolution in specific majors I include both primary degrees and secondary degrees. However, when focusing on the volume of degrees granted I include only the primary degrees. We exclude majors with 20 or fewer majors granted in 2024. Certain CIP Codes are excluded from the majors analysis (eg all Military Technologies and Applied Sciences are Excluded).